
Page 26 - 630578_IBAT-Jan-Feb2018
P. 26
bank’s deposit base provides value as a it (CDs) are generally considered non-core because
source of funds that’s typically less expen- near- or above-market rates are paid and are viewed
sive than alternative funding sources. The as being less relationship driven.
benefit of this cost savings is represented
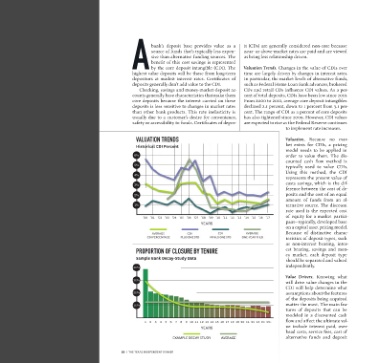
A by the core deposit intangible (CDI). The Valuation Trends. Changes in the value of CDIs over
highest value deposits will be those from long-term time are largely driven by changes in interest rates.
depositors at modest interest rates. Certificates of In particular, the market levels of alternative funds,
deposits generally don’t add value to the CDI. such as Federal Home Loan Bank advances, brokered
Checking, savings and money-market-deposit ac- CDs and retail CDs influence CDI values. As a per-
counts generally have characteristics that make them cent of total deposits, CDIs have been low since 2010.
core deposits because the interest carried on these From 2000 to 2010, average core deposit intangibles
deposits is less sensitive to changes in market rates declined 2.1 percent, down to 1 percent from 3.1 per-
than other bank products. This rate inelasticity is cent. The range of CDI as a percent of core deposits
usually due to a customer’s desire for convenience, has also tightened since 2009. However, CDI values
safety or accessibility to funds. Certificates of depos- are expected to rise as the Federal Reserve continues
to implement rate increases.
VALUATION TRENDS Valuation. Because no mar -
Historical CDI Percent ket exists for CDIs, a pricing
model needs to be applied in
% order to value them. The dis-
counted cash flow method is
%
typically used to value CDIs.
Using this method, the CDI
%
represents the present value of
costs savings, which is the dif-
%
ference between the cost of de-
% posits and the cost of an equal
amount of funds from an al-
% ternative source. The discount
rate used is the expected cost
’ ’ ’ ’ ’ ’ ’ ’ ’ ’ ’ ’ ’ ’ ’ ’ ’ ’ of equity for a market partici-
YEARS pant—typically, developed base
on a capital asset pricing model.
AVERAGE CDI CDI AVERAGE Because of distinctive charac-
CDI PERCENTAGE PLUS ONE STD MINUS ONE STD ONE-YEAR FHLB teristics of deposit types, such
as non-interest bearing, inter-
PROPORTION OF CLOSURE BY TENURE est bearing, savings and mon-
ey market, each deposit type
Sample Bank Decay-Study Data should be separated and valued
independently.
%
Value Drivers. Knowing what
%
will drive value changes in the
CDI will help determine what
% assumptions about the features
of the deposits being acquired
% matter the most. The main fea-
tures of deposits that can be
modeled in a discounted cash
+ flow and affect the ultimate val-
YEARS ue include interest paid, over-
head costs, service fees, cost of
alternative funds and deposit
26 | THE TEXAS INDEPENDENT BANKER